Book Description
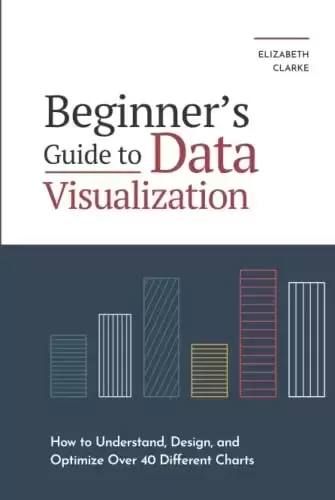
Are you struggling with turning data into insights? Always relying on the faithful pie chart? If you want to learn 40+ different ways to visualize data and how to design them for success, this is the book for you.
Data is the new oil. Data is essential for companies to predict trends, identify opportunities and be two steps ahead of the competition by providing them with important insights before they happen.
But all this data would render useless without something called data visualization, the ability to turn raw information into meaningful insights. Mastering this skill will undoubtedly lead to better and faster business decisions.
Whether you’re a data scientist working in tech, transforming consumer behavior into valuable information, a product manager looking to enhance user experience, or brand new to the industry wondering where to start, data visualization is key.
But, To unlock the door to successful data visualizations, you’ll need to learn a few things, such as :
- How people process information
- The fundamentals of data visualization
- Over 40+ charts, so your tool belt is full
- A comprehensive design guide
- How to redesign a visual from bland to stunning
And so much more….
Luckily all of these things are covered in Beginners Guide to Data Visualization
No matter what industry you work in, there is always a need for better forecasting and understanding of a company’s data. Those who develop data visualization skills will play a key role in an organization’s growth and will lead the charge, carving a better path forward for company success.
Click the buy now button above to spice up the “skillsets” section of your resume and become an asset to your team.
中文:
书名:数据可视化初学者指南: 如何理解、设计和优化40多种不同的图表
你
在努力将数据转化为洞察力吗?总是依赖忠实的饼图?如果你想学习40种不同的方法来可视化数据,以及如何设计它们以取得成功,这本书就是给你的。
数据是新石油。数据对于公司预测趋势,识别机会并在竞争发生之前为他们提供重要的见解,从而在竞争中领先两步至关重要。
但是,如果没有所谓的数据可视化,即将原始信息转化为有意义的见解的能力,所有这些数据将变得毫无用处。掌握这项技能无疑会带来更好、更快的商业决策。
无论您是从事科技工作的数据科学家,将消费者行为转化为有价值的信息,还是希望增强用户体验的产品经理,还是行业新手,都想知道从哪里开始,数据可视化都是关键。
但是,要打开成功进行数据可视化的大门,您需要学习一些知识,例如:
- 人们如何处理信息
- 数据可视化基础
- 超过40张图表,所以你的工具带是满
- 综合设计指南
- 如何重新设计视觉从平淡到令人惊叹
的
还有更多…。
幸运的是,数据可视化初学者指南涵盖了所有这些内容
无论你在哪个行业工作,总是需要更好地预测和理解公司的数据。那些开发数据可视化技能的人将在组织的增长中发挥关键作用,并将带头,为公司的成功开辟一条更好的道路。
单击上方的 “立即购买” 按钮,为简历的 “技能” 部分增添趣味,并成为团队的资产。
评论前必须登录!
注册