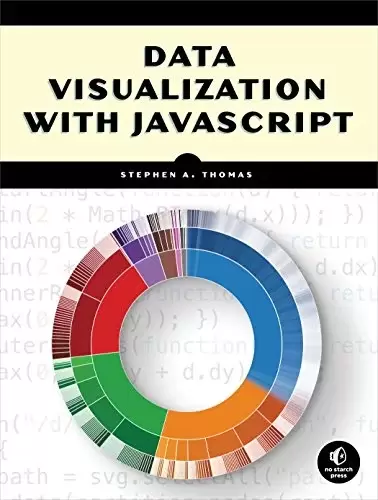
Book Description
You’ve got data to communicate. But what kind of visualization do you choose, how do you build it, and how do you ensure that it’s up to the demands of the Web?
In Data Visualization with JavaScript, you’ll learn how to use JavaScript, HTML, and CSS to build the most practical visualizations for your data. Step-by-step examples walk you through creating, integrating, and debugging different types of visualizations and will have you building basic visualizations, like bar, line, and scatter graphs, in no time.
Then you’ll move on to more advanced topics, including how to:
- Create tree maps, heat maps, network graphs, word clouds, and timelines
- Map geographic data, and build sparklines and composite charts
- Add interactivity and retrieve data with AJAX
- Manage data in the browser and build data-driven web applications
- Harness the power of the Flotr2, Flot, Chronoline.js, D3.js, Underscore.js, and Backbone.js libraries
If you already know your way around building a web page but aren’t quite sure how to build a good visualization, Data Visualization with JavaScript will help you get your feet wet without throwing you into the deep end. Before you know it, you’ll be well on your way to creating simple, powerful data visualizations.
Table of Contents
Chapter 1: Graphing Data
Chapter 2: Making Charts Interactive
Chapter 3: Integrating Charts on a Page
Chapter 4: Creating Specialized Graphs
Chapter 5: Displaying Timelines
Chapter 6: Visualizing Geographic Data
Chapter 7: Custom Visualizations with D3.js
Chapter 8: Managing Data in the Browser
Chapter 9: Building Data-Driven Web Applications: Part 1
Chapter 10: Building Data-Driven Web Applications: Part 2
中文:
书名:Data Visualization with JavaScript
你已经有数据可以交流了。但你会选择什么类型的可视化,如何构建它,以及如何确保它符合网络的需求?
In 用JavaScript实现数据可视化,您将学习如何使用JavaScript、HTML和CSS为您的数据构建最实用的可视化。循序渐进的示例将指导您创建、集成和调试不同类型的可视化,并将使您立即构建基本的可视化,如条形图、折线图和散点图。
然后,您将继续学习更高级的主题,包括如何:
- 创建树状图、热图、网络图、字云和时间线
- 绘制地理数据地图,并构建迷你图和复合图表
- 使用AJAX增加互动性和检索数据
- 管理浏览器中的数据并构建数据驱动的Web应用程序
- 利用Flotr2、Flot、Chronoline.js、D3.js、UnderScotre.js和Backbone.js库的强大功能
如果你已经知道构建网页的方法,但不太确定如何构建良好的可视化效果, 用JavaScript实现数据可视化 会帮你把脚弄湿,而不会把你推入深渊。不知不觉中,您就可以很好地创建简单、强大的数据可视化了。
Table of Contents
Chapter 1: Graphing Data
第2章:使图表具有互动性
第3章:在页面上集成图表
第4章:创建专门的图形
第5章:显示时间表
Chapter 6: Visualizing Geographic Data
第7章:使用D3.js的定制可视化
第8章:在浏览器中管理数据
第9章:构建数据驱动的Web应用程序:第1部分
第10章:构建数据驱动的Web应用程序:第2部分
评论前必须登录!
注册