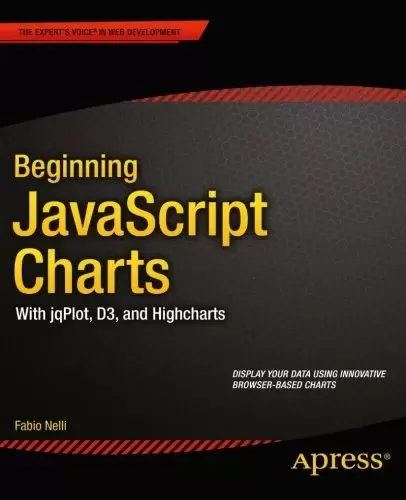
Book Description
Beginning JavaScript Charts: With jqPlot, d3, and Highcharts shows how to convert your data into eye-catching, innovative, animated, and highly interactive browser-based charts. This book is suitable for developers of all experience levels and needs: for those who love fast and effective solutions, you can use the jqPlot library to generate charts with amazing effects and animations using only a few lines of code; if you want more power and need to create data visualization beyond traditional charts, then D3 is the JavaScript library for you; finally, if you need a high-performance, professional solution for interactive charts, then the Highcharts library is also covered.
If you are an experienced developer and want to take things further, then Beginning JavaScript Charts also shows you how to develop your own graphics library starting from scratch using jQuery. At the end of the book, you will have a good knowledge of all the elements needed to manage data from every possible source, from high-end scientific instruments to Arduino boards, from PHP SQL databases queries to simple HTML tables, and from Matlab calculations to reports in Excel. You will be able to provide cutting-edge charts exploiting the growing power of modern browsers.
- Create all kinds of charts using the latest technologies available on browsers (HTML5, CSS3, jQuery, jqPlot, D3, Highcharts, and SVG)
- Full of step-by-step examples, Beginning JavaScript Charts introduces you gradually to all aspects of chart development, from the data source to the choice of which solution to apply.
- This book provides a number of tools that can be the starting point for any project requiring graphical representations of data, whether using commercial libraries or your own
What you’ll learn
- Learn the jqPlot, D3, Highcharts, CSS, jQuery and SVG basics.
- Discover the world of JavaScript graphic libraries.
- Discover which charts can best represent your data.
- Switch from a vision of a chart sent from a server as a static image to a highly dynamic one, in which the user is able to interact in real time.
- Perform input data manipulation to increase chart readability.
- Develop your own graphic library.
Who this book is for
Beginning JavaScript Charts is for developers at all levels interested in data visualization, and ready to embrace modern web standards and animate and display their data with powerful, cutting-edge technologies.
Table of Contents
Chapter 1: Charting Technology Overview
Chapter 2: jQuery Basics
Chapter 3: Simple HTML Tables
Chapter 4: Drawing a Line Chart
Chapter 5: Drawing a Bar Chart
Chapter 6: Drawing a Pie Chart
Chapter 7: Creating a Library for Simple Charts
Chapter 8: Introducing jqPlot
Chapter 9: Line Charts with jqPlot
Chapter 10: Bar Charts with jqPlot
Chapter 11: Pie Charts and Donut Charts with jqPlot
Chapter 12: Candlestick Charts with jqPlot
Chapter 13: Scatter Charts and Bubble Charts with jqPlot
Chapter 14: Funnel Charts with jqPlot
Chapter 15: Adding Controls to Charts
Chapter 16: Embedding jqPlot Charts in jQuery Widgets
Chapter 17: Handling Input Data
Chapter 18: Moving from jqPlot to Highcharts
Chapter 19: Working with D3
Chapter 20: Line Charts with D3
Chapter 21: Bar Charts with D3
Chapter 22: Pie Charts with D3
Chapter 23: Candlestick Charts with D3
Chapter 24: Scatterplot and Bubble Charts with D3
Chapter 25: Radar Charts with D3
Chapter 26: Handling Live Data with D3
Appendix A: Guidelines for the Examples in the Book
Appendix B: jqPlot Plug-ins
中文:
书名:开始的JavaScript图表
开始的JavaScript图表:使用jqPlot、d3和HighChart它展示了如何将您的数据转换为引人注目、创新、动画和高度交互的基于浏览器的图表。本书适合所有经验水平和需求的开发人员:对于那些喜欢快速有效的解决方案的人,你可以使用jqPlot库来生成具有惊人效果和动画的图表,只需几行代码;如果你想要更强大的功能,并需要在传统图表之外创建数据可视化,那么D3是为你准备的JavaScript库;最后,如果你需要一个高性能的,专业的交互式图表解决方案,那么HighChats库也包括在内。
如果您是一位经验丰富的开发人员,并希望进一步发展,那么起头JavaScript Charts 还向您展示了如何使用jQuery从头开始开发您自己的图形库。在这本书的最后,您将很好地了解管理来自各种可能来源的数据所需的所有元素,从高端科学仪器到Arduino电路板,从PHP SQL数据库查询到简单的HTML表格,从MatLab的计算到Excel中的报告。您将能够提供利用现代浏览器日益增长的功能的尖端图表。
- 使用浏览器上可用的最新技术(HTML5、CSS3、jQuery、jqPlot、D3、HighChats和SVG)创建各种图表
- Full of step-by-step examples, 起头JavaScript Charts 逐步向您介绍图表开发的各个方面,从数据源到选择要应用的解决方案。
- 本书提供了许多工具,可以作为任何需要以图形表示数据的项目的起点,无论是使用商业库还是您自己的库
What you’ll learn
- 学习jqPlot、D3、HighChart、CSS、jQuery和SVG基础知识。
- 探索JavaScript图形库的世界。
- Discover which charts can best represent your data.
- 将从服务器发送的图表作为静态图像切换到高度动态的图表,其中用户能够实时交互。
- 执行输入数据操作以提高图表的可读性。
- Develop your own graphic library.
Who this book is for
起头JavaScript Charts 面向对数据可视化感兴趣的所有级别的开发人员,并准备好接受现代Web标准,并使用强大的尖端技术来动画和显示他们的数据。
Table of Contents
第1章:制图技术概述
Chapter 2: jQuery Basics
Chapter 3: Simple HTML Tables
第4章:绘制折线图
第5章:绘制条形图
第6章:绘制饼图
第7章:为简单图表创建库
Chapter 8: Introducing jqPlot
Chapter 9: Line Charts with jqPlot
Chapter 10: Bar Charts with jqPlot
第11章:带有jqPlot的饼图和甜甜圈图
第12章:使用jqPlot绘制烛台图表
第13章:使用jqPlot绘制散点图和气泡图
Chapter 14: Funnel Charts with jqPlot
Chapter 15: Adding Controls to Charts
第16章:在jQuery小部件中嵌入jqPlot图表
Chapter 17: Handling Input Data
第18章:从jqPlot过渡到HighChart
Chapter 19: Working with D3
第20章:带D3的折线图
第21章:带有D3的条形图
Chapter 22: Pie Charts with D3
第23章:带D3的烛台图
第24章:D3的散点图和气泡图
Chapter 25: Radar Charts with D3
第26章:使用D3处理动态数据
附录A:本书中示例的指导原则
Appendix B: jqPlot Plug-ins
评论前必须登录!
注册