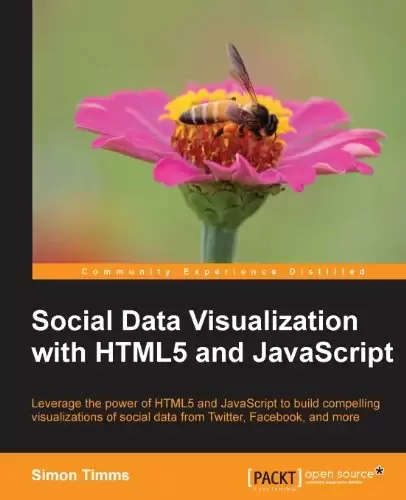
Book Description
The increasing adoption of HTML5 opens up a new world of JavaScript-powered visualizations. By harnessing the power of scalable vector graphics (SVGs), you can present even complex data to your users in an easy-to-understand format and improve the user experience by freeing users from the burden of tabular data.
Social Data Visualization with HTML5 and JavaScript teaches you how to leverage HTML5 techniques through JavaScript to build visualizations. It also helps to clear up how the often complicated OAuth protocol works to help you unlock a universe of social media data from sites like Twitter, Facebook, and Google+.
Social Data Visualization with HTML5 and JavaScript provides you with an introduction to creating an accessible view into the massive amounts of data available in social networks. Developers with some JavaScript experience and a desire to move past creating boring charts and tables will find this book a perfect fit. You will learn how to make use of powerful JavaScript libraries to become not just a programmer, but a data artist.
By using OAuth, which is helpfully demystified in one of the book’s chapters, you will be able to unlock the universe of social media data. Through visualizations, you will also tease out trends and relationships which would normally be lost in the noise.
What you will learn from this book
- Understand how the ever-growing world of data can be simplified through visualization
- See how traditional graphs fall down in the face of modern visualization
- Explore the various features of HTML5 which allow for creating visualizations
- Investigate how social networks delegate authority through OAuth
- Discover what data is available on Stack Overflow, Facebook, Twitter, and Google+
- Create exciting graphs which go beyond the normal standards
- Simplify your code with scales, layouts, and other features of the d3.js visualization library
- Set up Node.js as a platform to develop visualizations from social media
Approach
This book is a fast-paced guide full of step-by-step instructions that teach you how to visualize social data using HTML5 and JavaScript.
Who this book is for
This book is for developers who are excited about data and who want to share that excitement with others. Developers who are interested in the data which can be extracted from social networks will also find this book hugely beneficial.
Readers should have a working knowledge of both JavaScript and HTML.
Table of Contents
Chapter 1: Visualizing Data
Chapter 2: JavaScript and HTML5 for Visualizations
Chapter 3: OAuth
Chapter 4: JavaScript for Visualization
Chapter 5: Twitter
Chapter 6: Stack Overflow
Chapter 7: Facebook
Chapter 8: Google+
中文:
书名:使用HTML5和JavaScript实现社交数据可视化
HTML5越来越多地被采用,开辟了一个基于JavaScript的可视化的新世界。通过利用可伸缩矢量图形(SVG)的强大功能,您可以以易于理解的格式向用户呈现甚至复杂的数据,并通过将用户从表格数据的负担中解放出来来改善用户体验。
使用HTML5和JavaScript的社交数据可视化将教您如何通过JavaScript利用HTML5技术来构建可视化。它还有助于澄清通常复杂的OAuth协议是如何工作的,以帮助您从Twitter、Facebook和Google+等网站解锁大量社交媒体数据。
使用HTML5和JavaScript的社交数据可视化介绍了如何为社交网络中可用的海量数据创建可访问的视图。具有一定的JavaScript经验并希望不再创建乏味的图表和表格的开发人员会发现这本书非常适合。您将学习如何利用强大的JavaScript库不仅成为一名程序员,而且成为一名数据艺术家。
通过使用OAuth,这本书的一个章节很有帮助地揭开了神秘的面纱,你将能够解锁社交媒体数据的宇宙。通过可视化,你还将梳理出通常会在噪音中迷失的趋势和关系。
你将从这本书中学到什么
- 了解如何通过可视化简化不断增长的数据世界
- 了解传统图表在现代可视化面前是如何衰落的
- 探索HTML5的各种特性,这些特性允许创建可视化
- 调查社交网络如何通过OAuth授权
- 了解Stack Overflow、Facebook、Twitter和Google+上的可用数据
- 创建超出正常标准的激动人心的图表
- 使用D3.js可视化库的比例、布局和其他特性简化您的代码
- 将Node.js设置为开发社交媒体可视化效果的平台
方法
这本书是一本节奏很快的指南,里面充满了循序渐进的指导,教你如何使用HTML5和JavaScript可视化社交数据。
这本书是为谁而写的
这本书是为那些对数据感到兴奋并希望与他人分享这种兴奋的开发人员而写的。对可以从社交网络中提取的数据感兴趣的开发人员也会发现这本书非常有用。
读者应该对JavaScript和HTML都有一定的实用知识。
Table of Contents
第1章:可视化数据
Chapter 2: JavaScript and HTML5 for Visualizations
第3章:OAuth
第4章:可视化的Java脚本
Chapter 5: Twitter
第6章:堆栈溢出
Chapter 7: Facebook
Chapter 8: Google+
评论前必须登录!
注册